Source imaging
Back-projection imaging
A large earthquake radiates high-frequency waves from wherever its rupture front is at each moment. Back-projection turns a dense seismic array into an antenna that points at those sources, and so tracks the rupture in space and time without assuming a fault model. Much of our methodological work has been to make these images sharper and more reliable.
Delay and stack
Take a trial source location. For each station, predict the travel time from that point, shift the recording by it, and sum. If the trial point is where the waves came from, the shifted traces line up and add constructively; if not, they partly cancel. Scanning a grid of trial points in successive short time windows gives the brightest radiators as a function of time, which trace the rupture front.
Beamforming in one picture
SchematicRadiators of recent large earthquakes
Each dot is the location of peak high-frequency radiation in one time window, from slowness-enhanced back-projection (SEBP) of teleseismic P waves. Colour gives time after origin and size the normalised beam power. The inset plots distance from the epicentre against time; its slope is the rupture speed. Different arrays see the same rupture from different directions, so switching arrays is a quick test of robustness.
Back-projection playback
Published dataSources: Mandalay, Xu et al. (2025) Science, data doi:10.5281/zenodo.17113746; Noto, Xu et al. (2024) Science, doi:10.5281/zenodo.12786109; Türkiye, Xu et al. (2023) Commun. Earth Environ., doi:10.5281/zenodo.10040732 (CH = Chinese array); Maduo, Xu et al. (2023) JGR, doi:10.5281/zenodo.7761908. Palu: single-array MUSIC back-projection of the Australian-array data shipped with the public MUSICBP code, with the beam-power map of each 10 s window; consistent with Bao et al. (2019), whose figure uses multi-array SEBP; windows with normalised power below 0.34 are hidden. The Venezuela result belongs to a submitted manuscript and has not been peer reviewed. Coastlines: Natural Earth.
Making back-projection sharper and more reliable
MUSIC back-projection
Beamforming blurs sources that radiate at the same time from nearby points. We brought the MUltiple SIgnal Classification (MUSIC) method into back-projection, with multitaper cross-spectra to handle non-stationary seismic signals. It sharpens the image of the rupture process considerably (Meng et al., 2011, GRL; 2012, JGR).
tools/make_figures.py.Reference windows against the “swimming” artefact
Conventional sliding-window back-projection produces transients that migrate across the image toward the array, because earthquake waveforms are impulsive rather than stationary. Aligning each window on a reference window instead of absolute time suppresses this artefact without losing resolution (Meng et al., 2013, Earth Planets Space).
Slowness calibration with aftershocks (SEBP)
Different arrays can image the same earthquake differently, mainly because 3-D Earth structure distorts travel times in an array-specific way. Besides aligning the first arrival on the hypocentre, we correct the slowness, i.e. how travel time changes with source position, using aftershocks with known locations. This makes images from different arrays agree (Meng, Zhang & Yagi, 2016, GRL), and the regional version reduces spatial bias further (Zhang et al., 2023, JGR). The public code is in MUSICBP (SEBP branch).
Depth: 3-D back-projection
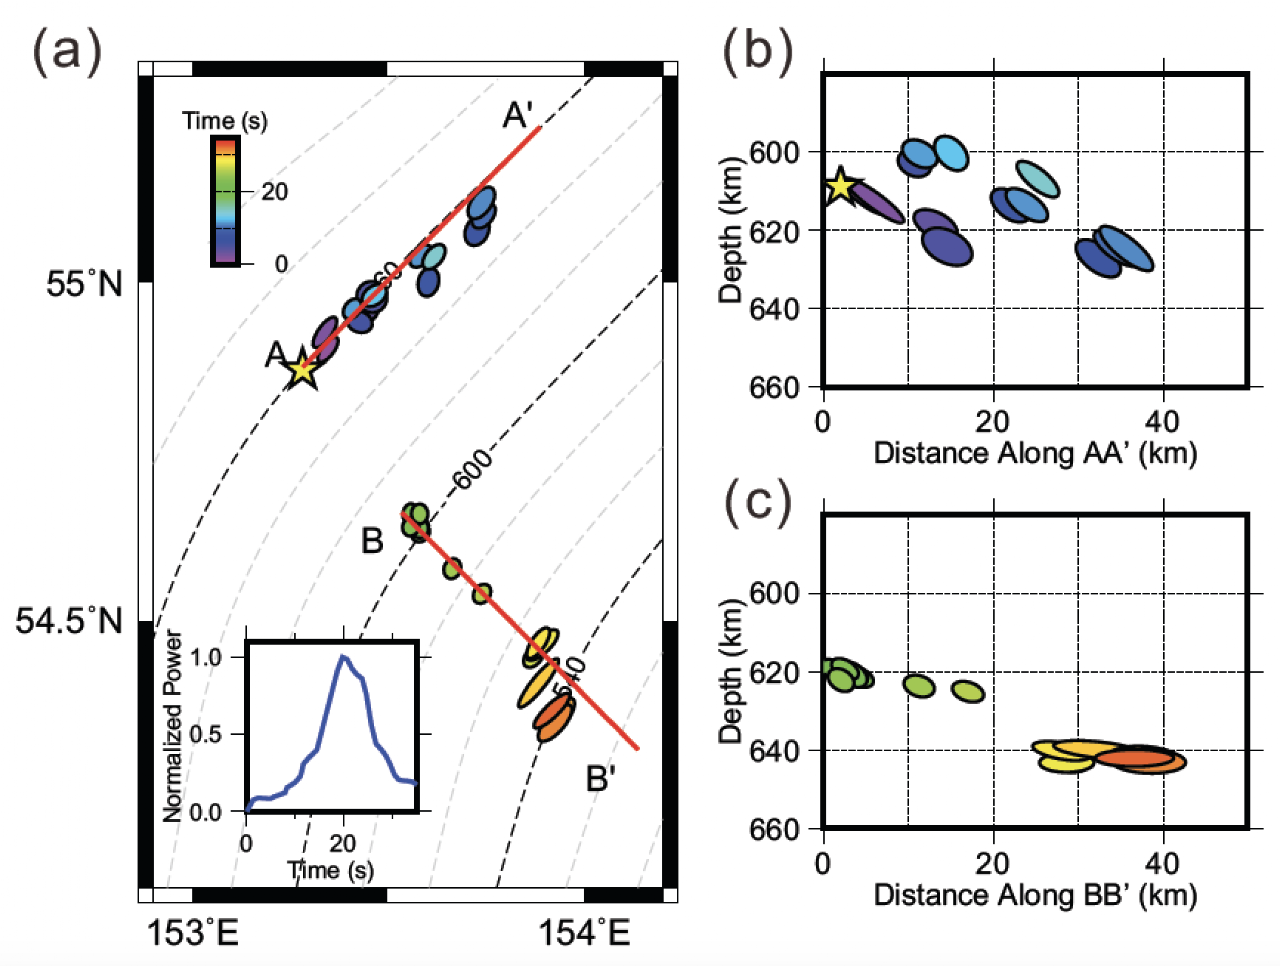
Teleseismic rays are steep, so back-projection resolves position well but depth poorly. Combining P with the depth phase pP, whose ray paths cross, recovers depth. For the 2013 Mw 8.3 Okhotsk deep-focus earthquake it shows a mostly horizontal rupture deepening southward, consistent with failure on sub-parallel planes in an en-echelon pattern (Meng et al., 2014, GRL).
Southern Hemisphere: PKIKP back-projection
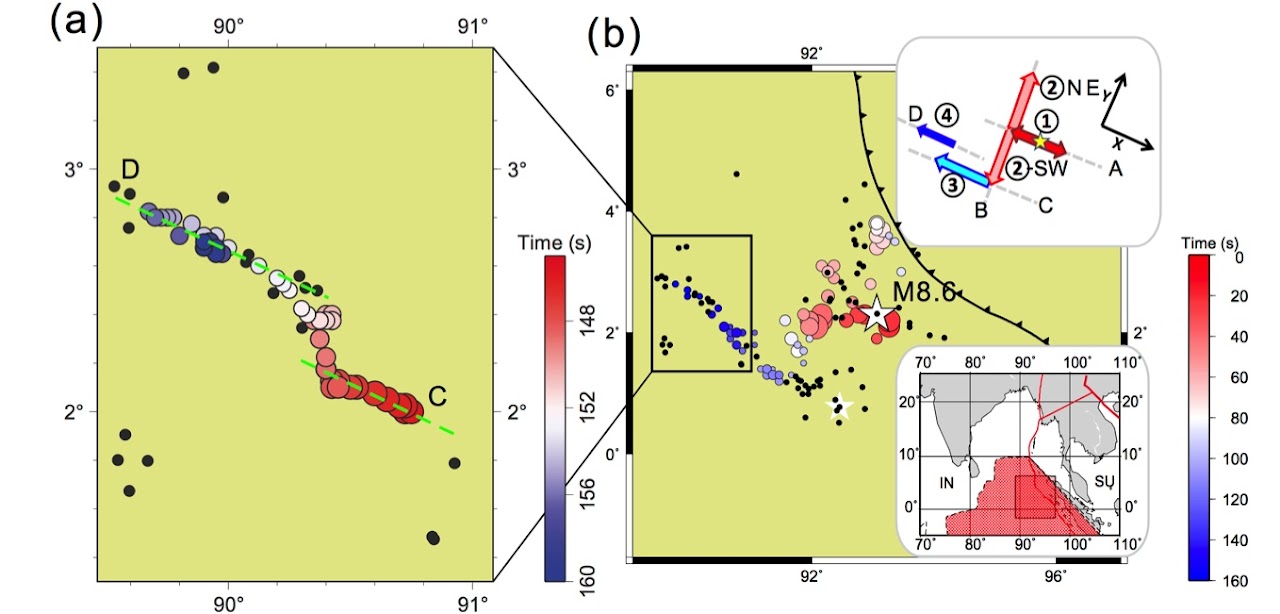
Most large arrays are in the Northern Hemisphere, out of teleseismic range of many southern earthquakes. The core phase PKIKP at 150–180° reaches resolution comparable to P-wave back-projection, validated on the 2010 Chile, 2021 Haiti and 2021 Kermadec earthquakes (Xu, Meng & Chu, 2025, JGR).
Arrays for earthquake early warning
Early-warning systems that treat an earthquake as a point underestimate large ruptures while they are still growing. Small-aperture arrays near active faults can back-project in real time and follow rupture length, duration and directivity as they develop, which could extend finite-source warning to M > 7 events; we demonstrated the idea with the 2004 Parkfield and 2010 El Mayor–Cucapah earthquakes (Meng, Allen & Ampuero, 2014, BSSA). Multi-array local back-projection later imaged the 2019 Ridgecrest sequence (Xie, Bao & Meng, 2021, JGR), and a high-frequency distance metric from back-projection improves ground-motion prediction (Feng & Meng, 2018, GRL).
Key papers
- 2025JGR: Solid Earth 130, e2025JB031667
- 2023JGR: Solid Earth 128, e2022JB025525
- 2016Geophysical Research Letters 43, 628–636
- 2014Bulletin of the Seismological Society of America 104, 2553–2561
- 2012Journal of Geophysical Research 117, B04313
- 2011Geophysical Research Letters 38, L00G07